研究方法 / 三阶段框架 概览
- 阶段一:Seed Alpha Factory (SAF) — LLM 生成
- 使用 GPT-4o 对 11 篇文献与多模态数据进行 prompt-engineered 提取,生成 100 个 seed alphas,分为 9 类(Momentum, Mean Reversion, Volatility, Fundamental, Growth, Quality, Liquidity, Technical, Macro)。
- 输出为可执行公式(表达式树)与类别标注。
- 阶段二:Multimodal Multi-Agent Evaluation
- 多模态输入:文本、数值、视觉(K-line)、音频、视频。
- 多智能体:Confidence Score Agent (CSA) 评估统计可靠性
- 依据综合分数
- 阶段三:Dynamic Weight Optimization
- 构建 3 层 MLP(输入层 = |$$selected alphas|$$|,隐藏层 10 个 ReLU 节点,输出 1 个节点预测收益),训练目标为最小化预测收益误差并学习 alpha 权重。
研究方法 / 具体步骤与实现细节
- 数据准备:日内 OHLCV + VWAP;季度/年财报;宏观指标;时间段覆盖 Jan 2019–Jun 2024(实验部分)。
- LLM Prompting:基于论文/文档列表(见附录 A.2)设计 prompt,要求 GPT-4o 生成公式化 alpha 与类别并输出表达式树。
- SAF 构建:把 LLM 输出存入工厂,形成可检索的 seed alpha 集合(示例见 Appendix A.3)。
- 多模态 backtest:用历史数据对每个 alpha 做 IC、Sharpe 等评估,CSA/RPA 分别输出 confidence 与 risk score。
- Category-Based Alpha Selection(Algorithm 1):对每类选出表现优异且通过阈值的 alpha,保证类别多样性。
- Weight training(Algorithm 2 Phase 3):构造 X_train(历史 alpha 值)与 y_train(未来收益),训练 MLP 得到权重
- 交易规则:等权持仓选 top-k,限制每日最大换手 n,交易成本建模并在回测中考虑。
研究方法 / 明显创新
- LLM 用于“公式化 alpha”生成:不是生成自然语言建议,而是生成可执行的表达式(如 CLOSE - DELAY(SMA(CLOSE,14),7)),并输出表达式树与示例计算步骤,便于直接实现与回测(见 Appendix A.1、A.3)。
- 多模态 + 多智能体评估:结合文本/数值/图表信息,通过 CSA 与 RPA 并行评估 alpha 的统计性与风险特性,保持类别平衡的自动化选择算法(Algorithm 1)。
- 动态权重优化与策略自适应:用深度模型(MLP)将历史 alpha 序列映射到未来收益,从而得到能随市场状态变化的组合权重,实现策略在线化更新。
- 端到端自动化流水线:从文献/多模态输入自动生成、筛选、权重训练并回测,减小人工干预,便于持续增量更新 SAF。
主要结论
- 结论 1:LLM 与多智能体评估能生成并筛选出高质量、可执行的 alpha,提升因子信号的统计与经济性能(IC、回测收益均改善)。
- 结论 2:多模态信息整合使 alpha 选择更具环境适应性——不同市场/时期(示例:2022 vs 2023)选择不同类型 alpha(波动/基本面 vs 动量/成交量)。
- 结论 3:动态权重优化(MLP)能把历史 alpha 序列映射为收益预测,从而得到自适应组合权重,提升回测表现与下行保护能力。
- 结论 4:消融研究显示 CSA(Confidence Score Agent)对保持熊市下的稳定性尤其关键;两智能体共同提升预测稳定性(见 Table 7/8)。

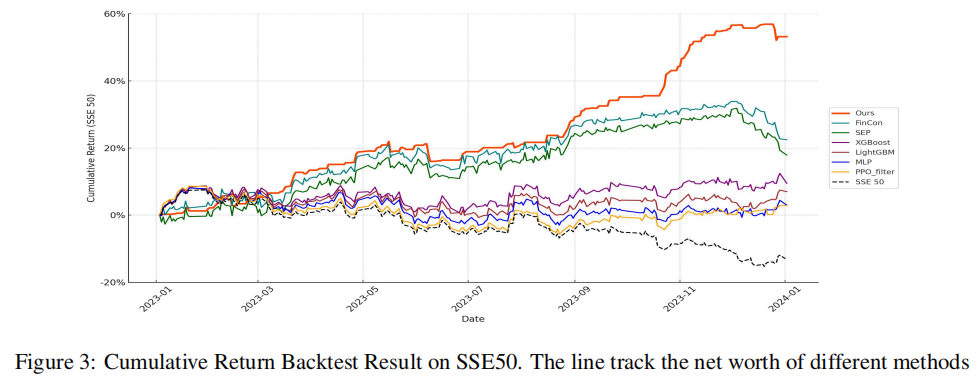
Table 4: Performance Comparison of Trading Strategie
| Strategy | Final Return (%) | Sharpe Ratio | Volatility (%) | Sortino Ratio | Calmar Ratio |
|---|---|---|---|---|---|
| This Work | 53.173 | 0.287 | 0.762 | 0.208 | 1.052 |
| XGBoost (Chen and Guestrin, 2016) |
9.532 | 0.038 | 1.019 | 0.067 | 0.103 |
| LightGBM (Ke et al., 2017) |
7.125 | 0.030 | 0.993 | 0.053 | 0.066 |
| MLP | 3.110 | 0.013 | 0.960 | 0.023 | 0.043 |
| PPO_filter (Schulman et al., 2017) |
2.865 | 0.013 | 0.886 | 0.024 | 0.017 |
| FinCon (Yu et al., 2024) |
22.474 | 0.077 | 1.196 | 0.126 | 0.232 |
| SEP (Koa et al., 2024) |
17.891 | 0.060 | 1.217 | 0.103 | 0.157 |
| SSE 50 | -13.22 | -0.063 | 0.859 | -0.111 | -0.043 |
创新点
- 创新点:
- 首次(或显著)将 LLM 输出的可执行公式化 alpha(expression trees)与多模态多智能体评估流水线结合,实现端到端的自动化 alpha 挖掘与组合构建。
- 引入类别平衡的自动选择算法(Category-Based Alpha Selection)以避免单一因子类别过度集中。
- 融合统计度量(IC)、风险偏好评估与深度学习权重训练,桥接“统计改进”与“经济可执行”的差距。
- 学术贡献:
- 为“LLM 在量化投资中的应用”提供实证基准、可复现算法与一套评估流程(包括多市场、多周期的稳健性验证)。
现实意义与行业影响
- 对量化投资实践:
- 提供自动化工具,可加速因子研究周期、提高因子发现效率并减少人力成本;尤其适合需要处理大量文献与多模态数据的场景。
- 动态权重与多智能体评估有助于在剧烈市场变化中获得更好的下行保护与风险调整收益。
- 对金融科技与监管:
- 促进 Fin-LLM 与多智能体系统在资金管理机构的应用,但需关注模型透明性、合规性与因果稳健性(论文也指出了输入偏置与可解释性问题)。
- 局限性(论文自身提出):
- 依赖输入文档质量(可能放大偏见);LLM 生成的 alpha 有时缺乏金融直觉;多智能体评估基于历史关系,面对结构性断裂可能失效;目前主要验证于权益市场,跨资产需进一步检验。
问题4:如何使用LLMs进行股票预测与分析?
传统/经典方法
- 依赖基本面与技术分析:
- 针对技术指标的单一分析可能导致信息的片面化。
存在的痛点与困难
- 市场变化快速:
- 仅依赖于历史数据分析不再充分,无法适应快速市场变动。
大语言模型的做法
-
多源信息结合:
- 通过使用LLMs进行多种文本数据分析,生成更全面的市场视图。
-
通过自然语言技术获取情感指标:
- 使用NLP分析市场情绪和趋势,以优化策略决定。
实际应用案例
如何利用LLMs进行有效的股价预测?
Lopez‑Lira, A., & Tang, Y. (2023). Can ChatGPT Forecast Stock Price Movements? Return Predictability and Large Language Models. SSRN Working Paper. (First Version: April 6, 2023; This Version: April 9, 2023).
研究背景
- 核心问题:LLM(以 ChatGPT 为代表)是否能通过对新闻标题的情感判定,预测股票的短期收益?
- 研究动机:传统情感分析方法(如 RavenPack)用于预测收益,但 LLM 的语言理解能力更强,可能捕获更多语境/细微含义,从而提高预测能力。
- 文献位置:交叉于文本分析、情感预测与 AI 对金融决策影响的文献;补充了关于 LLM 在金融市场预测领域的初步实证证据。
研究目标
- 总体目标:评估 ChatGPT 对新闻标题的情感分类能否在 out-of-sample 情形下预测次日股票收益,并与现有情感产品(RavenPack)比较。
- 具体目标:
- 设计 prompt 并让 ChatGPT 对公司新闻标题输出“好/坏/不确定”;转换为数值分数(YES=1, UNKNOWN=0, NO=-1);计算公司每日平均得分(lag 1)。
- 用 CRSP 日收益与 RavenPack 新闻数据(relevance=100、事件相似度过滤)构建样本(Oct 2021 起,避免进入 ChatGPT 训练集时间)。
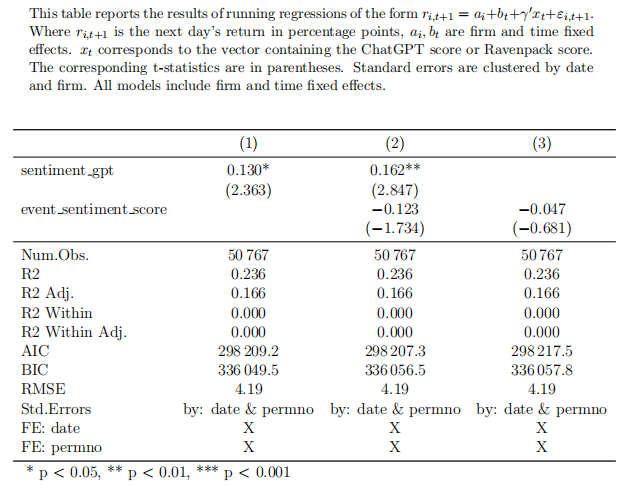
- 运行横截面/时间序列回归(包含 firm/date 固定效应)检验 ChatGPT 得分对次日收益的解释力,并与 RavenPack 分数比较。
- 检验稳健性:重复样本过滤、控制变量与聚类标准误,确保结果为 out-of-sample。
研究方法 / 数据
- 主要数据源:
- CRSP 日收益(股票回报、成交量、市值等)
- RavenPack 新闻标题(RavenPack Dow Jones edition)
- 样本选择规则:
- 时间窗口从 2021-10 开始(ChatGPT 训练截止至 2021-09,确保后训练期为 out-of-sample)。
- 仅保留 RavenPack relevance = 100、全文/新闻稿,并去除 event category = 'stock-gain' 或 'stock-loss'。
- 去重:同公司同日高度相似(string-similarity > 0.6)标题删除,保证只保留“新信息”。
- 样本规模(Paper 报表):N = 50,767 条公司-日新闻观测(见 Table 1)。
研究方法 / Prompt 与情感映射
- 使用的 Prompt:
Forget all your previous instructions. Pretend you are a financial expert. You are a financial expert with stock recommendation experience. Answer "YES" if good news, "NO" if bad news, or "UNKNOWN" if uncertain in the first line. Then elaborate with one short and concise sentence on the next line. Is this headline good or bad for the stock price of company name in the term term?
Headline: headline - 输出映射:
YES -> 1;UNKNOWN -> 0;NO -> -1 - 聚合规则:若同公司同日有多条标题,取这些 ChatGPT 得分的均值;随后对得分进行滞后一天(lag 1)用于预测次日收益(避免 look-ahead)。
研究方法 / 实证设计
- 核心回归形式:
- 其中
- 其中
- 估计细节:标准误按
date与permno聚类;所有结果均为 out-of-sample;若新闻在收盘后发布,作者保守地将可交易时间设为两天后(避免未来泄露)。 - 比较设定:单独使用 ChatGPT 分数、单独使用 RavenPack 分数、以及同时包含两者,检验各自系数与显著性。
结果:描述性统计
| Variable | Mean | SD | min | P25 | Median | P75 | Max | N |
|---|---|---|---|---|---|---|---|---|
| Daily Return (%) | 4.80 | 4.80 | -75.51 | -1.97 | -0.04 | 1.80 | 199.60 | 50767 |
| Headline Length | 77.63 | 29.49 | 22 | 57 | 71 | 92 | 701 | 50767 |
| ChatGPT Response Length | 153.64 | 38.50 | 0 | 124 | 151 | 179 | 303 | 50767 |
| GPT Score | 0.25 | 0.47 | -1 | 0 | 0 | 1 | 1 | 50767 |
| Event Sentiment Score | 0.16 | 0.34 | -1 | 0 | 0 | 0.50 | 1 | 50767 |
结果

|
|
结果的经济与统计解释
- 统计显著性:ChatGPT 得分系数在多种规格下显著(p<0.05 或 p<0.01),表明从新闻标题中提取的 ChatGPT 情感在样本期具有预测能力。
- 相对表现:当同时包含 ChatGPT 与 RavenPack 得分时,RavenPack 的系数失去显著性,暗示 ChatGPT 捕获了 RavenPack 未能表达或更细致的语境信息。
- 局限性:系数量级较小(收益变动仍以波动性为主),
稳健性与样本/方法注意项
- out-of-sample 设计:样本始于 2021-10,以保证 ChatGPT 的训练数据不会包含评估期信息(训练截止 2021-09)。
- 过滤与去重:使用 RavenPack relevance=100;去除同日高度相似标题(similarity > 0.6);排除标注为股票涨跌的 headline 类别。
- 聚类与固定效应:标准误聚类(date & permno),并包含 firm/date 固定效应,减少共同因子或公司不变特质的混淆。
- 保守的交易可用性假设:若新闻在收盘后发布,作者假设需等两天才能交易,避免未来信息使用。
主要结论
- 核心结论:ChatGPT 对新闻标题的情感判定在样本期内对次日股票收益具有统计显著的正向预测能力,且在控制 ChatGPT 得分后,传统 RavenPack 情感得分不再显著。
- 含义:LLM(ChatGPT)在理解自然语言语境方面的优势,使其在文本驱动的短期收益预测上比传统情感工具表现更好。
- 谨慎说明:尽管统计显著,但解释力有限(R^2 未显著提高),经济可交易性、交易成本、市场冲击与策略实现需进一步研究。
创新点、学术贡献与现实意义
- 创新点:将通用型 LLM(ChatGPT)直接用于大规模新闻标题情感判定,并将输出数值化用于 out-of-sample 股票收益预测;首次展示 ChatGPT 在该任务上优于商用情感产品的证据。
- 学术贡献:扩展文本分析与资产定价文献,探讨 LLM 在金融预测的潜力与局限,为后续研究(专门训练的金融 LLM、混合模型)提供实证基础。
- 现实意义:对投资机构与量化团队:提示 LLM 可作为新闻情绪处理的工具,但在将其用于交易决策前应评估执行成本、延迟与模型稳定性。对监管者:当 AI 驱动信息处理普及时,可能影响信息传播与市场反应,值得关注。
局限性与未来研究方向
- 局限性:
- 使用的是 ChatGPT(通用 LLM),非专门针对金融领域微调的模型;
- 研究关注短期(日频)预测,未扩展到长期或跨资产类别;
- 实证仅基于新闻标题,未结合全文语境或交互信息。
- 未来方向:开发或微调专用金融 LLM;结合更丰富的文本来源(全文、社交媒体)与结构化数据;将情感信号嵌入实盘交易策略并考虑交易成本/市场冲击;研究 LLM 在不同市场/时期的稳健性与因果机制。
基于机器学习的因子发现(Factor Factory)/因子工程
Han, et al. (2022). Factor Models, Machine Learning, and Asset Pricing. ARFE.
主要步骤
|
|
1 Pipeline 概览与工程化原则
- 步骤回顾(工程视角):
- Data ingestion → 2. Primitive generation → 3. Feature synthesis → 4. Sanity filtering → 5. ML screening → 6. Selection & aggregation → 7. Backtest → 8. Deploy & monitor
- 工程化原则:
- 可复现:版本控制(代码/参数/数据快照)
- 可审计:记录每次实验的 seed、超参、样本切分
- 时间一致性:严格按时间戳对齐,避免 look-ahead
- 可回滚:保存中间产物(候选因子库、IC 记录)
2 数据采集与质量控制(Data Ingestion)
- 数据类型:OHLCV、成交量、财务报表、期权 IV、新闻/文本、订单簿、宏观因子。
- 关键清洗步骤:
- 时间对齐:统一时区、交易日历;对公告类数据标注发布时间(pre/after-close)。
- 调整价格:
adjusted_price = raw_price / split_factor - dividend_adjustment。 - 缺失处理:
forward_fill或 删除 instrument(缺失比例 > threshold,如 20%) - 异常值处理:winsorize(如 1st/99th percentiles)或按上下限裁剪。
- 注意:对事件/文本数据,保留原始时间戳以判断可交易时间窗(tradeability)。
- 示例 checklist:文件命名、schema、null比率、唯一性(ticker+date)、调整标志。
3 原始变换(Primitive Features)
- 常用 primitives:price, log(price), return, volume, market_cap, volatility, earnings_yield
- 常见变换:
return_t = log(price_t) - log(price_{t-1})momentum_k = price_t / price_{t-k} - 1sma_k = rolling_mean(price, k)zscore_k = (x - rolling_mean(x,k))/ rolling_std(x,k)
- 多频率融合:同时计算日/周/月指标并作为独立特征(注意对齐)。
- 实现提示:对每个 primitive 建立标准化接口,返回
series与meta(window, freq, transform)。
4 自动化因子生成(Feature Synthesis)方法与范例
|
|
5 初筛(Sanity Checks & Correlation Filtering)
- 数值 sanity 检查:剔除常数/近常数(std < eps)、极端 NaN 比例、超宽分布异常(kurtosis)
- 相关性过滤:构造候选因子相关矩阵,使用阈值法或层次聚类保留代表变量:
- 方法 1:若 |corr(i,j)| > 0.95,保留信息量更高/稳定的一个
- 方法 2:层次聚类 + 每簇保留代表因子(例如 silhouette score 高者)
- 分布稳定性检验:在多个时间段(pre/post-crisis)比较均值与分位数,剔除跨期极不稳定者。
- 示例工具:heatmap 可视化、dendrogram 展示聚类结果。
6 ML 评估与边际贡献测试(Model-based Screening)
- 目标:衡量每个候选因子对未来收益的增量信息(marginal contribution)。
- 方法:
- 单因子 IC:
- 多因子/模型内重要性:把候选因子喂入 XGBoost/RandomForest 计算
feature_importances_;用 LASSO 得到稀疏线性系数。 - 边际贡献评估:在包含已有基线因子的模型里加入一个 candidate,比较 predictive R^2 / MSE 的增量。
- 单因子 IC:
- 滚动验证:用 rolling window 或 expanding window 计算 out-of-sample IC 来估计稳定性。
- 评价指标汇总:mean IC, IC t-stat, IC decay, feature importance, incremental R^2, p-value(bootstrap)。
- 伪代码:单因子 IC
for feat in candidates:
    ics = rolling_corr(feat.series, future_return, window=60)
    mean_ic = np.mean(ics)
    tstat = mean_ic / (np.std(ics)/np.sqrt(len(ics)))
    record(feat, mean_ic, tstat)
7 因子选择与稀疏化(Selection & Stability)
- 核心问题:如何从大量候选因子中选出稳定、低共线且具经济意义的子集?
- 方法清单:
- LASSO / ElasticNet:线性稀疏化,选择解释性强的因子。
- Group LASSO:按因子类别分组做稀疏化,保持类别多样性。
- Stability Selection(推荐):多次子样本 LASSO,保留出现频率高的变量(例如出现率 > 0.7)。
- Ensemble Voting:不同模型(LASSO、XGBoost、NN)分别选 top-k,然后取交集或投票制。
- 稳定性量化:记录每个因子在不同 folds/time windows 中的被选频率(selection frequency)。
- 示例伪代码(stability selection):
freq = defaultdict(int)
for i in range(n_rounds):
    Xs, ys = subsample(X, y, frac=0.7)
    model = Lasso(alpha=alpha).fit(Xs, ys)
    for feat in model.selected_features_:
        freq[feat] += 1
stable_feats = [f for f,c in freq.items() if c/n_rounds >= 0.7]
8 组合构建与回测实现(Backtest & Implementation)
- 从因子到信号:将因子值标准化(zscore 或 cross-sectional rank)得到 signal。
- 权重构建:等权 / IC 权重 / model-predicted weight(例如用 ML 输出做分位分配)。
- 约束考虑:市值中性、行业中性、最大单只权重、最大 turnover。
- 交易成本模型:基础佣金 + 滑点(spread/2)+ 市场冲击(例如 square-root law)。
- 回测细节:按事件可交易延迟(若新闻在 after-close,交易延迟至次一交易日或两日),模拟交易执行(partial fills)。
- 伪代码(简化回测):
for t in dates: signals = compute_signals(t) target_weights = construct_weights(signals) trades = rebalancing(target_weights, prev_weights, turnover_limit) pnl = execute_trades(trades, prices[t], costs_model) record_metrics(pnl) - 评估输出:P&L、Sharpe、Max Drawdown、turnover、IC over time、exposure summary。
9 部署、监控与生命周期管理(Monitoring)
- 监控指标:rolling IC (1/3/6/12 months), feature distribution drift (KL divergence), turnover, position concentration, model latency。
- 报警 & 自动化动作:当 rolling IC < threshold 或 KL > threshold → alarm → 自动进入回检或暂停下线。
- 再训练策略:定期(例如 monthly/quarterly)或基于触发器(IC 跌落)重新训练。
- 模型治理:记录模型版本、训练数据快照、权重变化日志以便审计。
- 示例阈值(课堂可讨论):IC_mean_3m < 0.01 或 KL_divergence > 0.2 → 触发 review。
10 可解释性与因果性检验工具(SHAP / LIME / PDP)
- 为什么重要:ML 产生黑箱信号,学术/合规/交易团队都需要解释信号来源与机制。
- 工具简介:
- SHAP:基于博弈论的特征贡献分解,提供全局与局部解释。
- LIME:局部线性拟合近似来解释单个预测。
- PDP / ICE:展示单变量对预测的平均/个体影响曲线。
- 使用示例:用 SHAP 解释 XGBoost top-10 variable contributions;用 PDP 查看某因子的非线性阈值效应。
11 实验/编程练习
- 练习 A(端到端):
- 数据:提供 5 年日频小样本(prices, volume, basics)
- 任务:生成 200 candidate factors → 初筛 → stability selection → 构建 long-short 组合 → 回测(包含成本) → 报告 IC & 回测结果与解释。
- 练习 B(可解释性):训练 XGBoost,使用 SHAP 解释 top-10 features,并撰写一页幻灯片解释经济机制。
附:关键伪代码与模块化实现建议
- 模块化结构:
data_loader、primitive_generator、synthesizer、sanity_filter、model_evaluator、selector、backtester、monitor。 - high-level 伪代码:
data = data_loader.load() primitives = primitive_generator(data) candidates = synthesizer(primitives) candidates = sanity_filter(candidates) scores = model_evaluator.score(candidates, returns) stable = selector.stability_select(scores) backtest_report = backtester.run(stable, data, cost_model) monitor.setup(backtest_report) - 可复现技巧:使用 config 文件管理超参;使用 MLFlow/Weights&Biases 做实验记录。
常见陷阱与防范
- 未来函数泄露:严格时间对齐,标注信息可用时间。 Warning: 常见错误来自使用报表发布日期而非报告覆盖期。
- 数据-snooping & multiple testing:记录测试次数,使用 out-of-time 或 Bonferroni/Benjamini–Hochberg 校正。
- 过拟合:偏好简单模型做 baseline;使用滚动验证、early stopping、正则化与 stability selection。
- 忽视交易成本:务必在回测中加入 realistic cost model。
- 缺乏监控:部署后无监控会导致模型失效而无人察觉。
小结:教学要点回顾
- 因子发现是工程+研究的闭环,ML 强化了自动化与非线性挖掘能力。
- 实践要求:严格的数据治理、时间一致性、稳健性验证、可解释性工具与成本敏感的回测。
- 最终目标:把统计改进转化为可实现的经济价值,同时保留经济解释与风险管理能力。
参考与延伸阅读
- Han, et al. (2022). Factor Models, Machine Learning, and Asset Pricing. ARFE.
- Gu, Kelly & Xiu (2020). Empirical Asset Pricing via Machine Learning. Review of Financial Studies.
- Molnar, C. (2020). Interpretable Machine Learning (SHAP/LIME/PDP).