Principal Components Analysis (PCA)
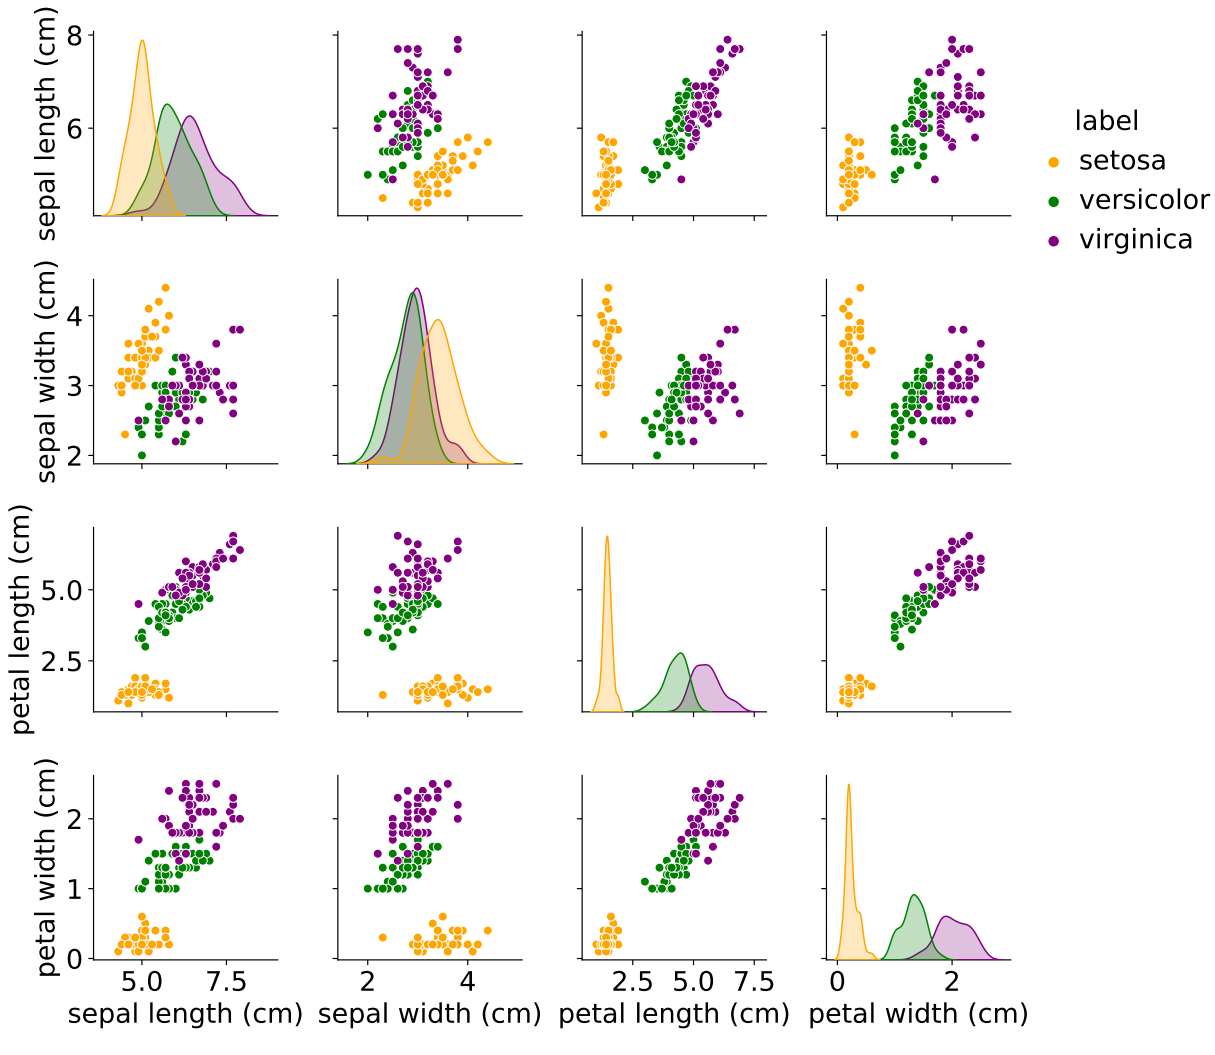
How to visualize high dimensional data? (The Iris Classification Example)
|
|
Examples
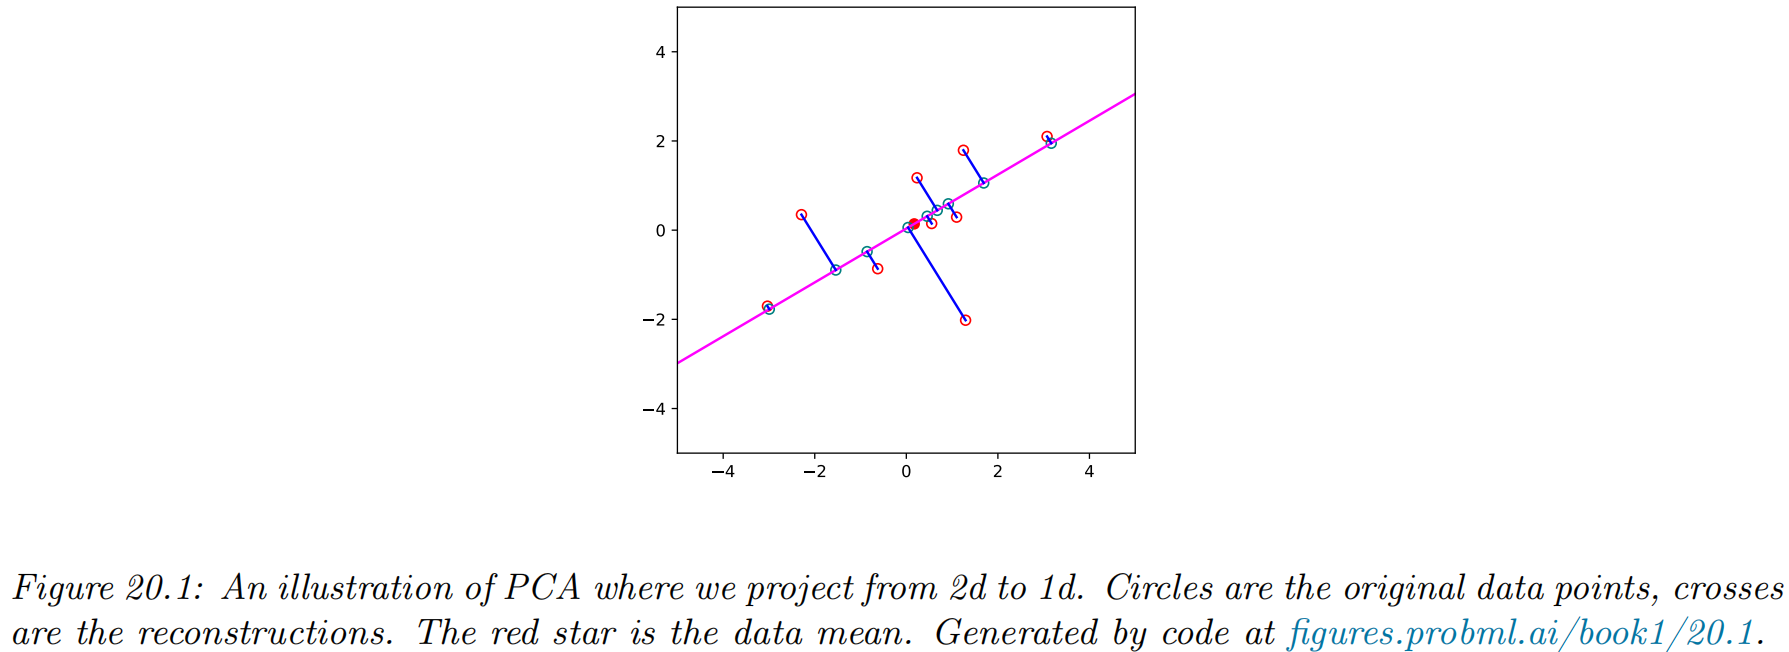
- a simple example project from 2d to 1d
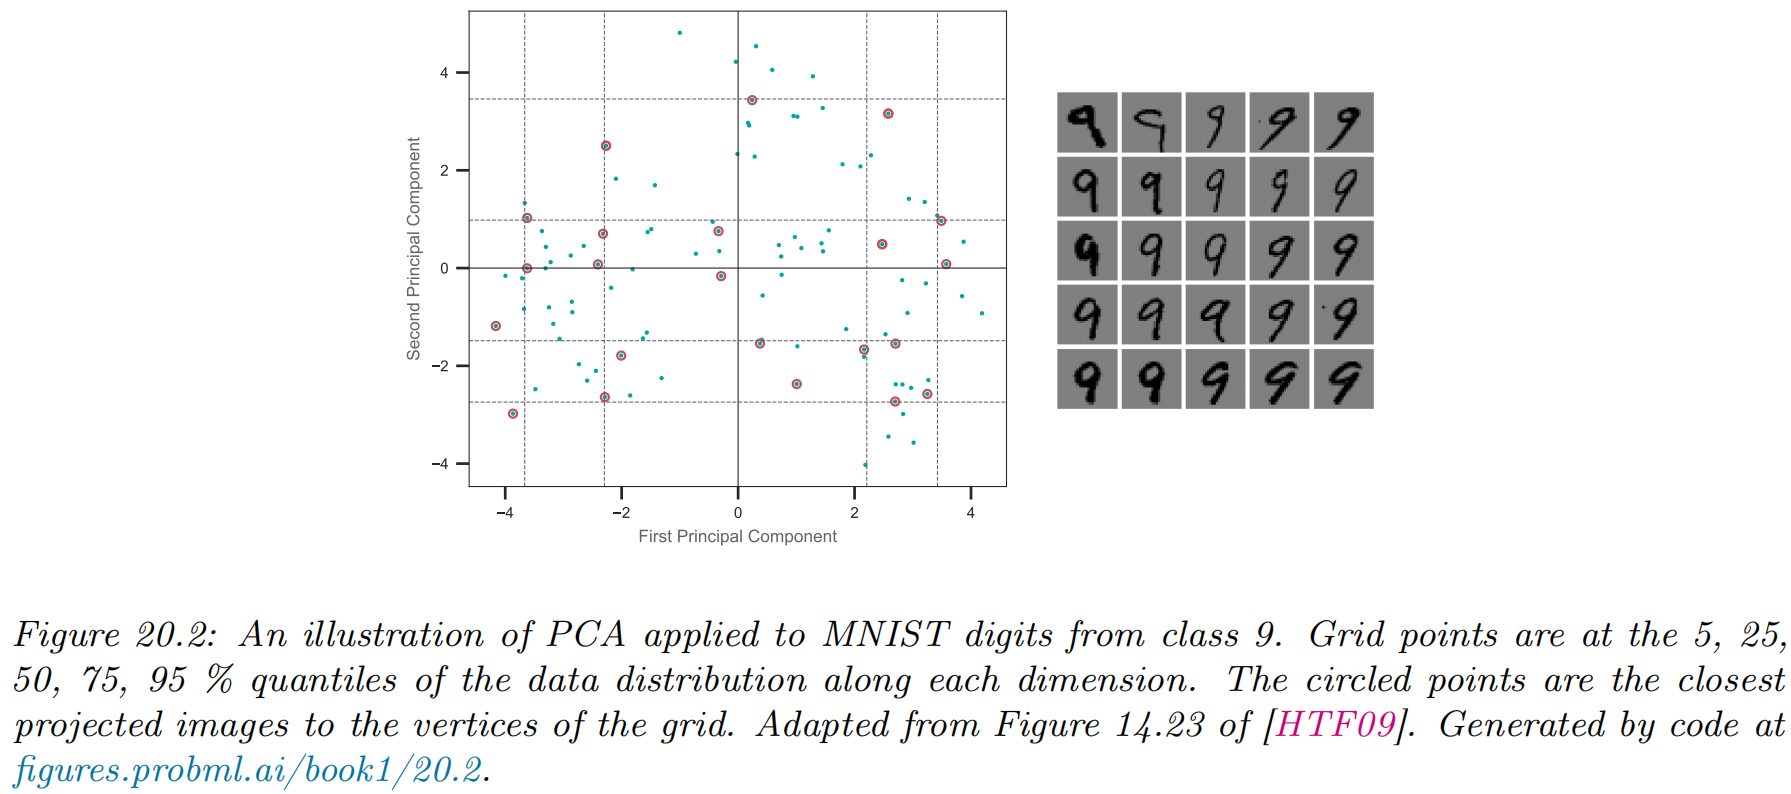
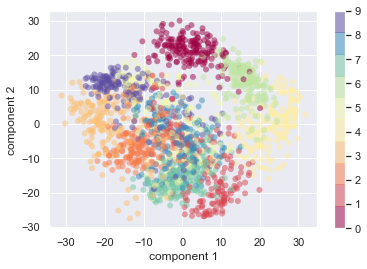
- hand writing digit recognition (28*28d to 2d)
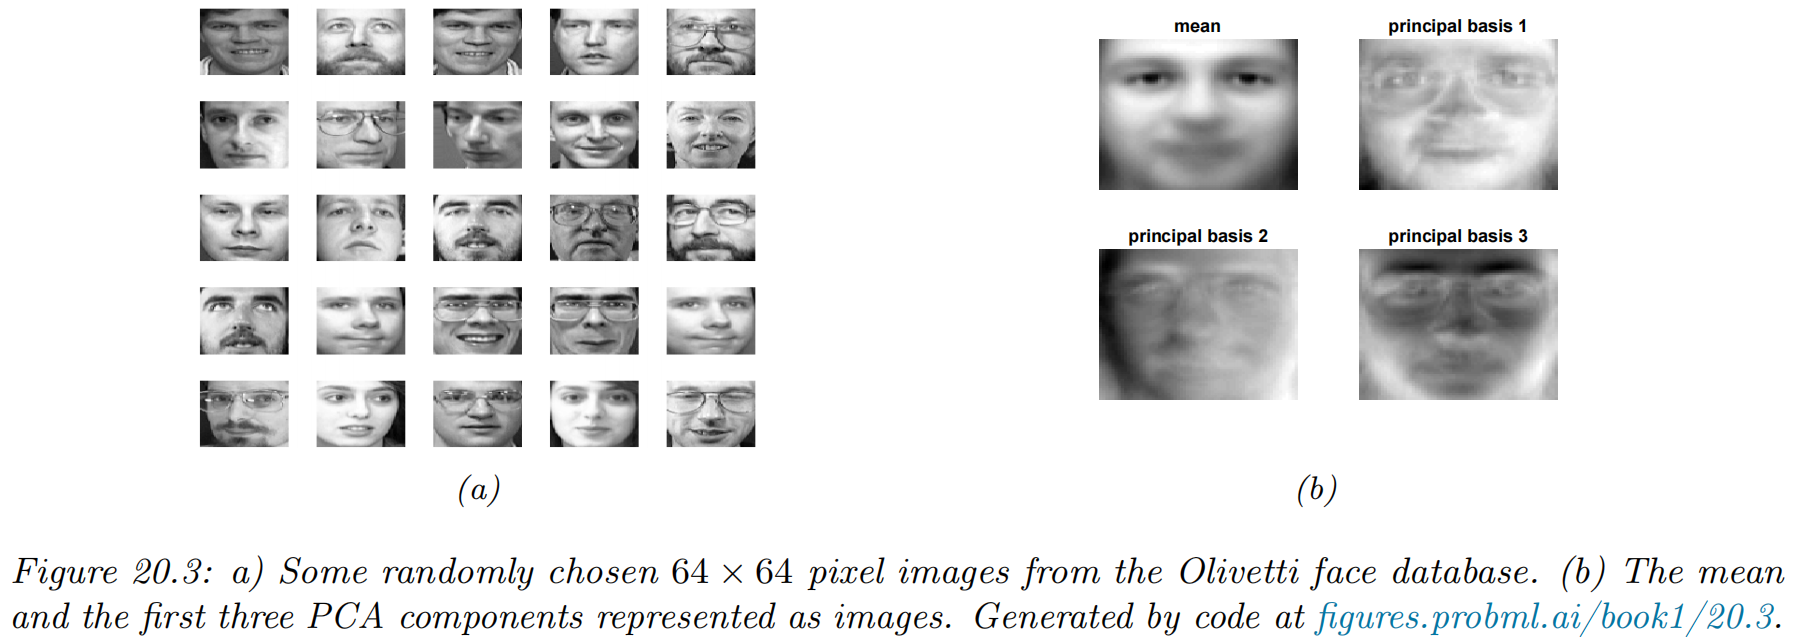
- human face recognition (64*64d to 3d)
A Detailed Example
-
A set of (p-dimensional) features
-
The first principal component
- is the normalized linear combination of the features that has the largest variance.
- the loadings of the first principal component:
- the principal component loading vector,
- for a specific point
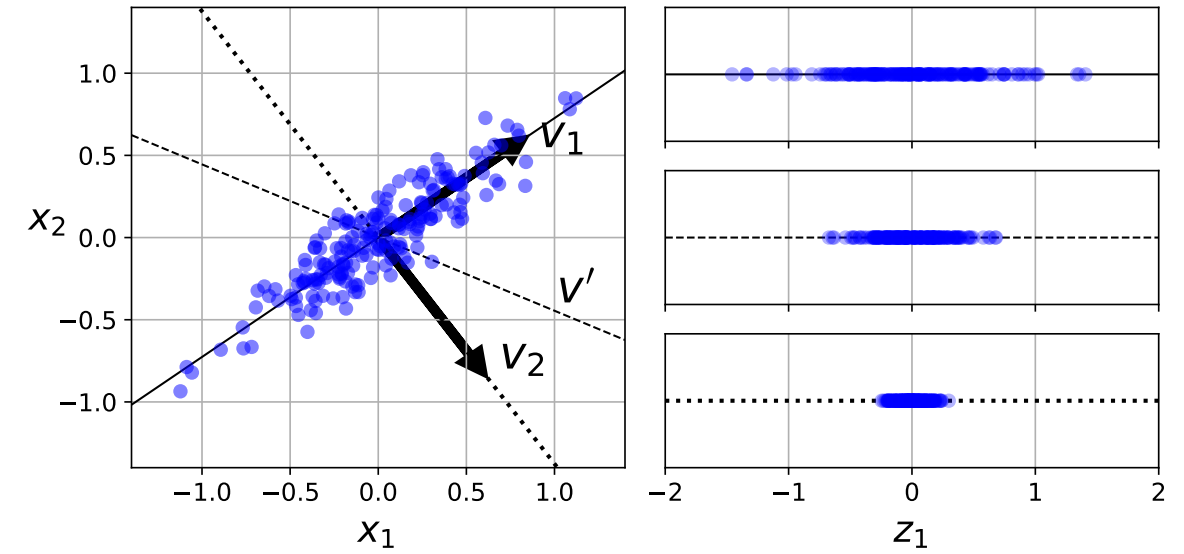
- the most imformative direction:
- the second principal component
- maximal variance out of all linear combinations that are uncorrelated with
- maximal variance out of all linear combinations that are uncorrelated with
Another Interpretation of Principal Components
Principal components provide low-dimensional linear surfaces that are closest to the observations.
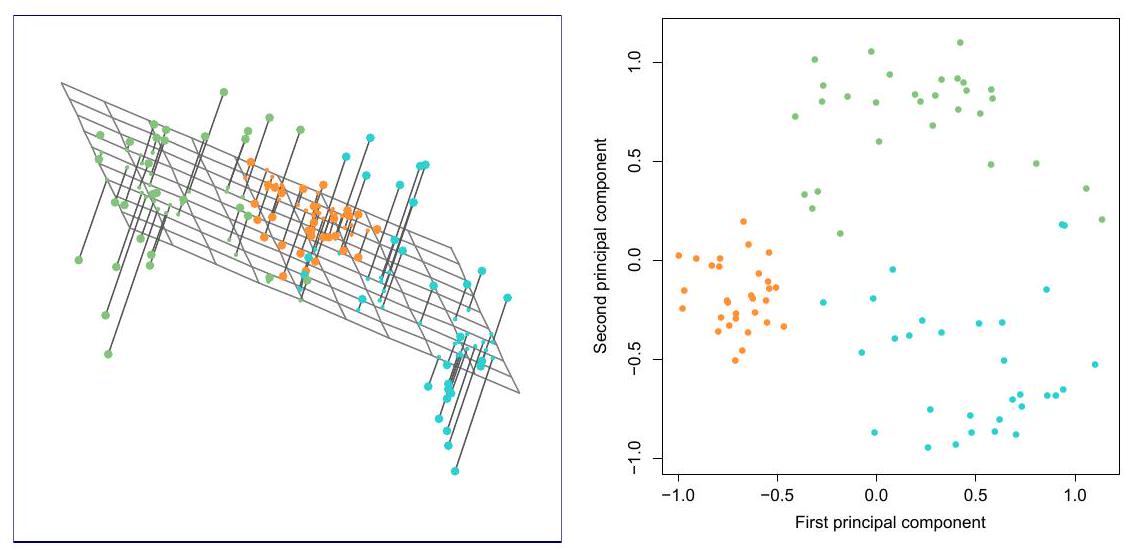
-
the best
-
the optimization problem
-
the smallest possible value of the objective in (12.6) is
- Principal component loading vectors can give a good approximation to the data when
The Proportion of Variance Explained (PVE)
-
The total variance present in a data set is defined as
-
the variance explained by the
-
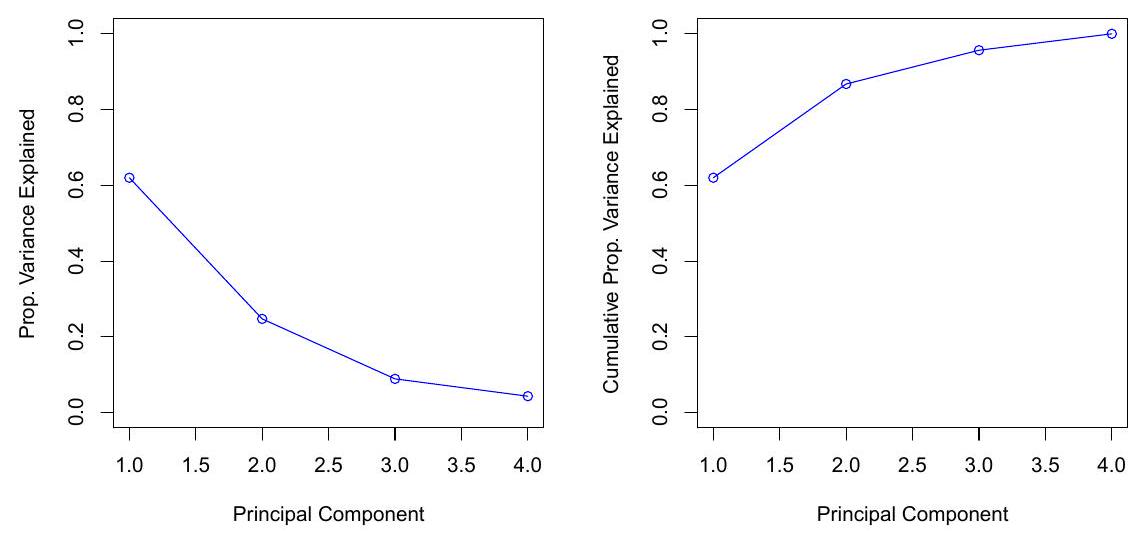
the PVE of the
-
the variance of the data can be decomposed into the variance of the first
-
we can interpret the PVE as the
Coding: Visualization
|
|
Clustering Methods
K-Means Clustering
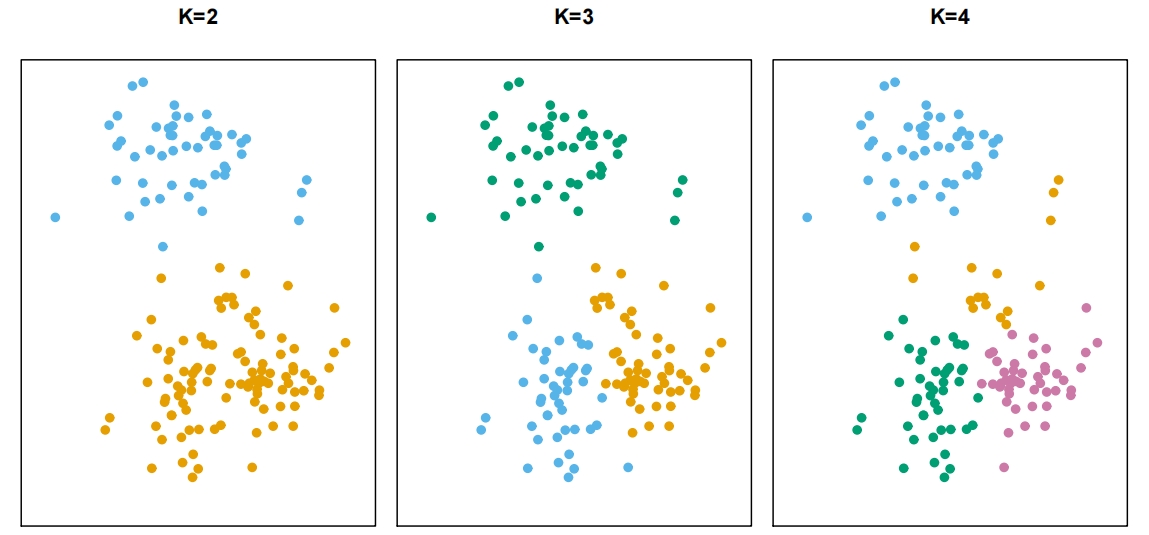
- Partitioning a data set into
- Let
-
-
-
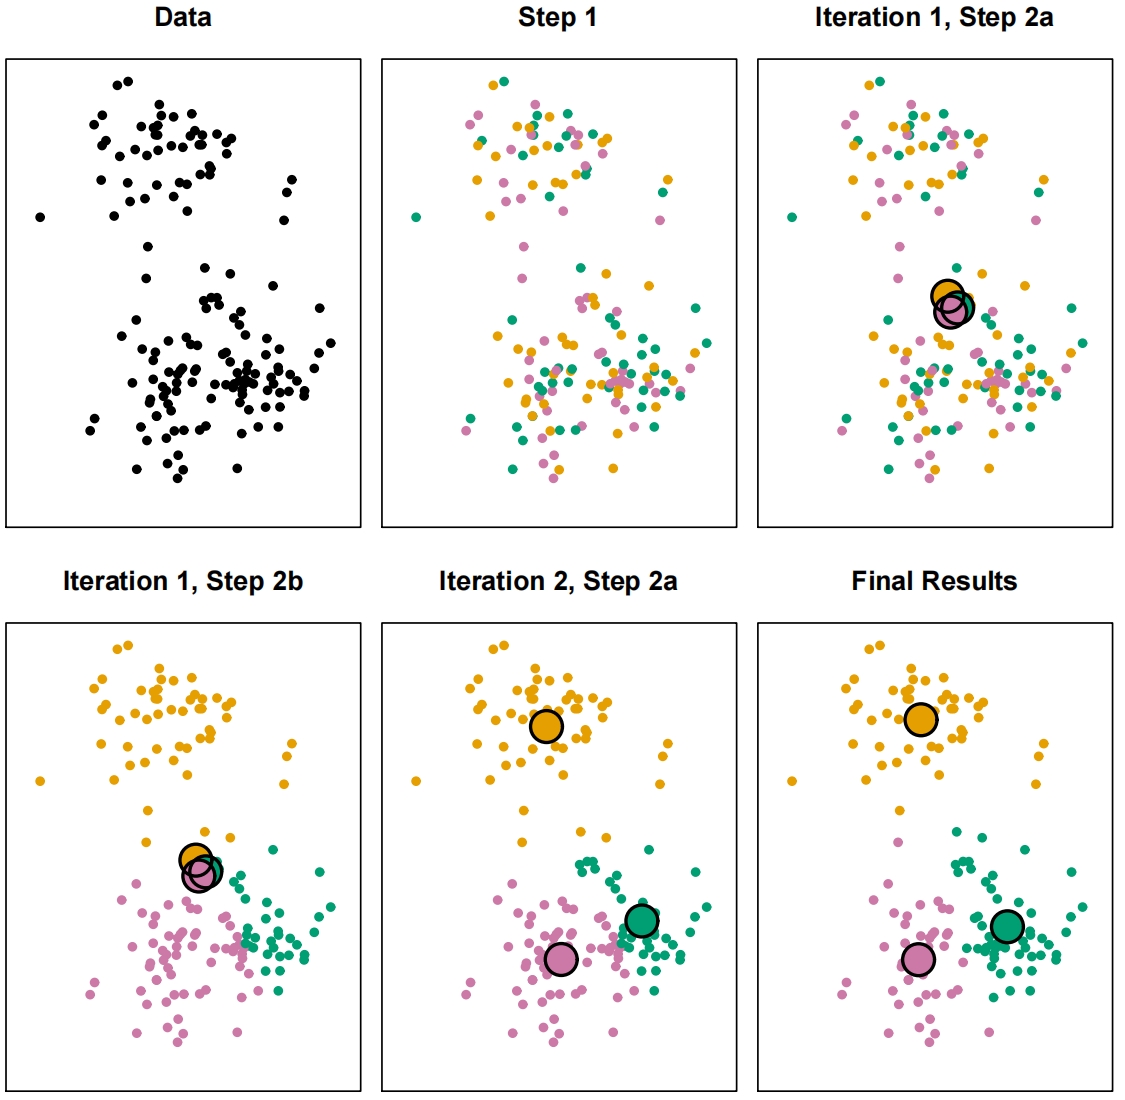
- the big idea
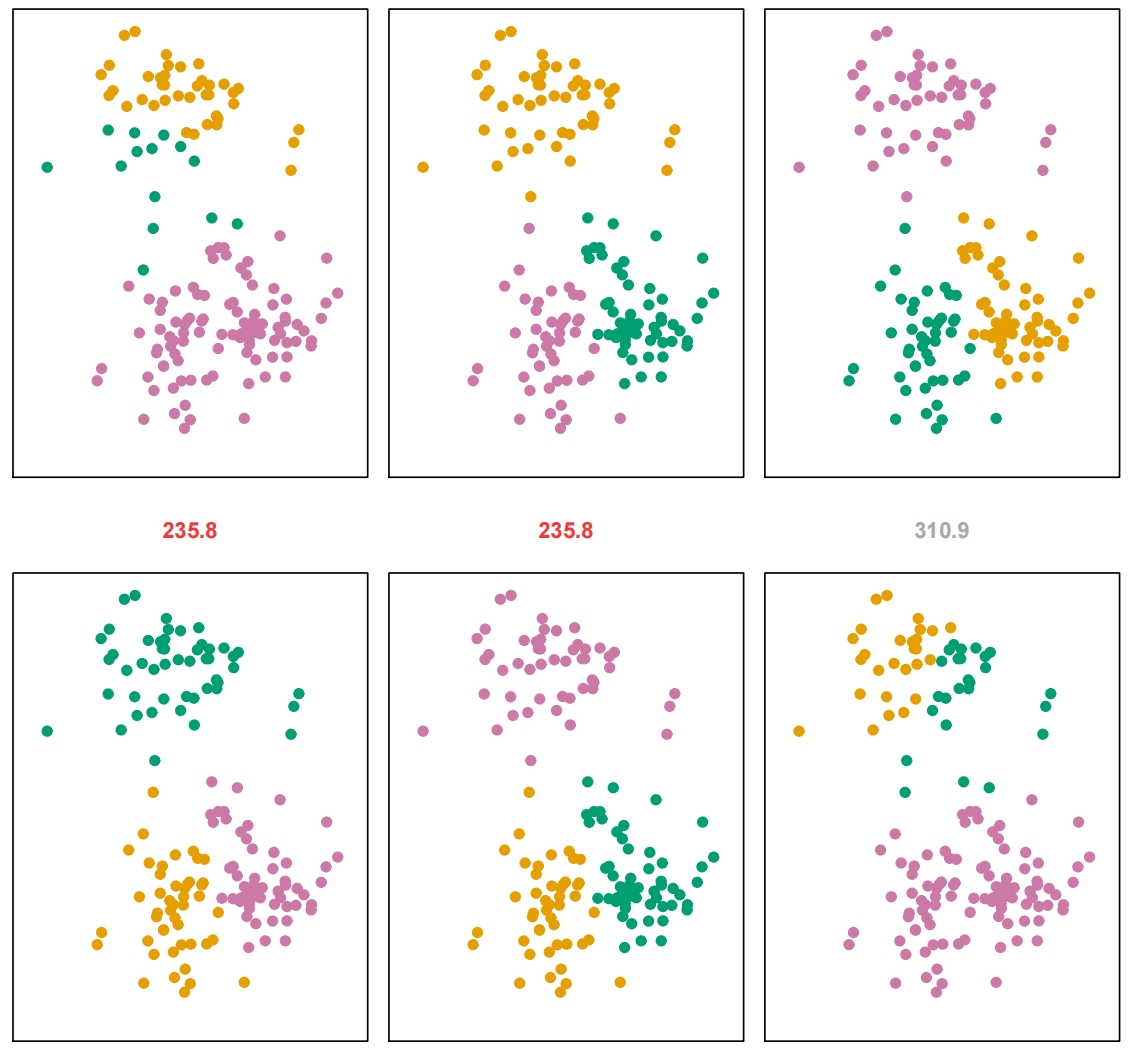
- within-cluster variation is as small as possible
- within-cluster variation
|
|